Skip to content
[render_menu Professionnels]
[render_menu "Service client"]
[render_menu "En savoir plus"]
Online Shop
FR
FR
Online Shop
FR
FR
FR
Recherchez d'autres sujets
Search
Search
Search
Rechercher
Accueil
Boutique en ligne
Nous contacter
[detecteur_de_langue]
Table of Contents
Recherchez d'autres sujets
Search
Search
Search
Rechercher
Home
Welcome to Sinopé help center
Recherchez d'autres sujets
Search
Search
Search
Rechercher
Device categories
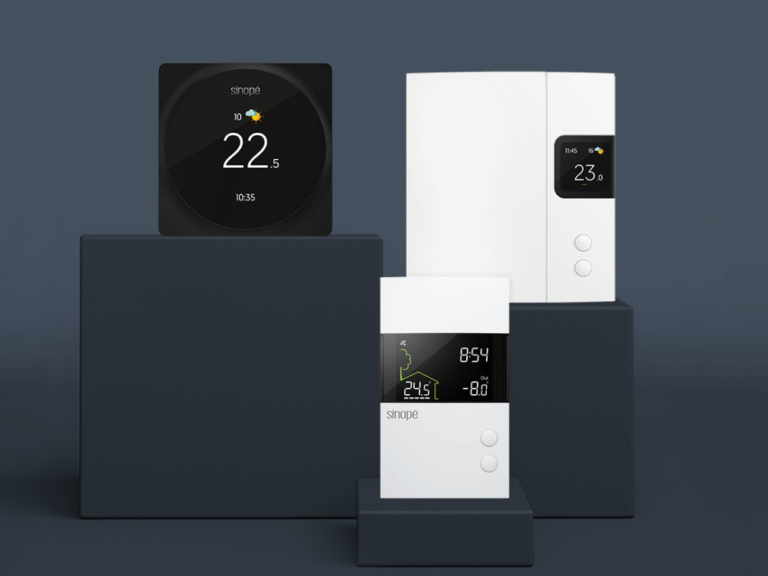
Thermostat
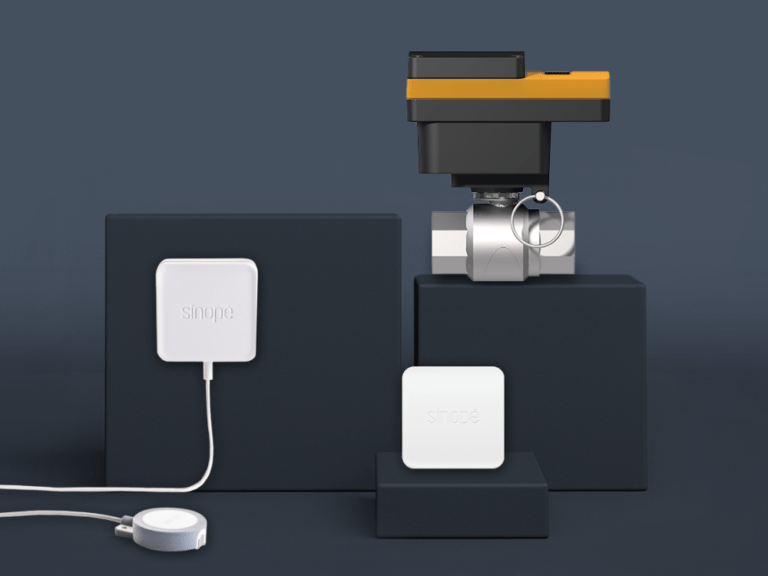
Water Damage
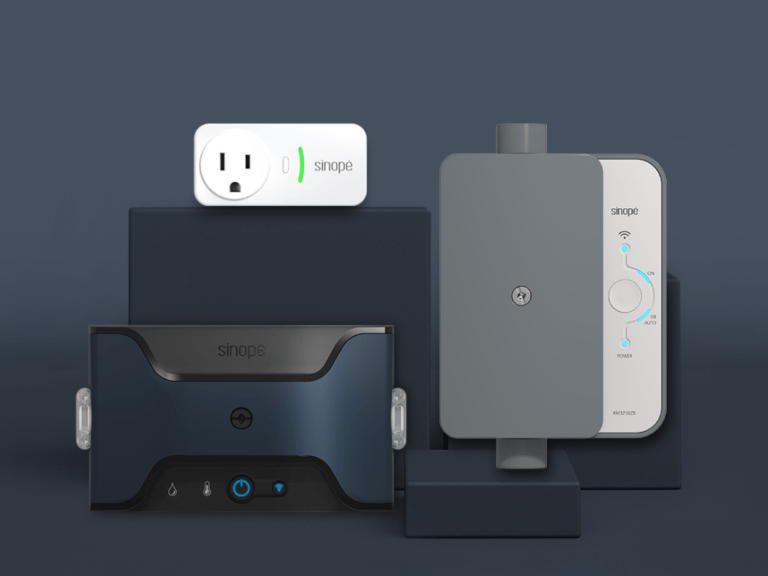
Protection
Specialized
Control
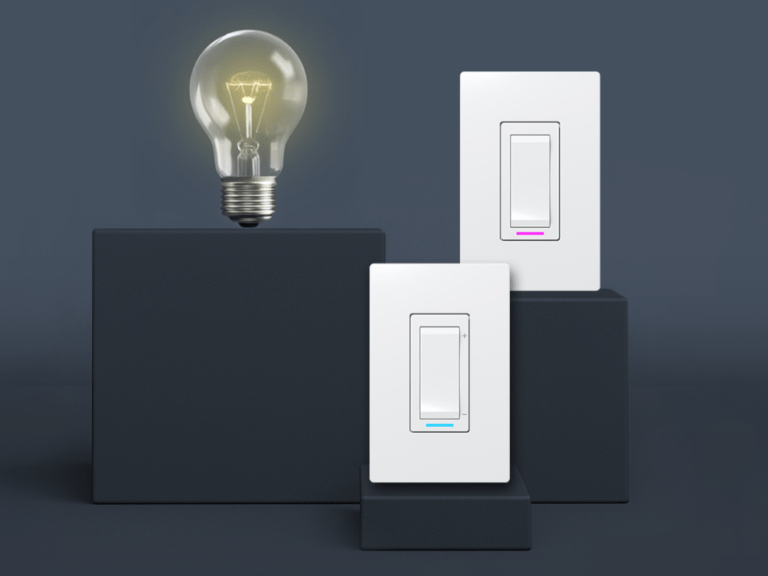
Lighting
Useful links & documentation
Neviweb user guide
Integration with other platforms
Éco Sinopé
Documentation
Neviweb assistance
The basics of Neviweb
Your Neviweb account
Neviweb account creation
The iOS and Android versions required to use the Neviweb application
Can I manage my devices with more than one account?
What are the usage or subscription fees for Neviweb?
The Neviweb.com website is experiencing display problems.
How do I add a GT130 gateway to my account if I already have a GT125 gateway?
Is Neviweb also available via internet browser?
What should I do if my Neviweb account is blocked?
How do I enable push notifications in Neviweb?
How do I add one or more sub-users to a Neviweb account?
How do I modify a sub-user’s information in Neviweb?
How do I delete a sub-user from a Neviweb account?
What are the limitations regarding the sub-user?
Table of permissions for Neviweb account users
Neviweb account settings
Reset password
Get to know Neviweb
First steps with Neviweb
Dashboard
Change my postal code to get the correct weather
What is the Present/Absent status?
Configure the actions triggered by the Absent / Present status
Understanding the interactions between automations and scenes
Add a device or scene to favorites
Control your devices
Add your device to Neviweb
Thermostat model selection
Add your TH1123ZB / TH1124ZB thermostat
Configure your TH1123ZB / TH1124ZB thermostat
Your TH1123ZB / TH1124ZB thermostat does not add to your Sinopé GT125 gateway.
There is a difference between the temperature on my thermometer and the one displayed on the thermostat.
The set temperature has been reached, but my thermostat continues to display 2 bars out of 5.
The thermostat restarts (reboot) often
What should I do if the room temperature displayed on the thermostat screen seems incorrect?
Are Sinopé thermostats Energy Star certified?
Add your TH1123WF / TH1124WF thermostat
Configure your TH1123WF / TH1124WF thermostat
I changed the display format (temperature/time) in my account settings, however my devices are still displaying the old format.
The different modes of your thermostat
Procedure for changing the heating mode of a thermostat
The early start
How do I lock the buttons on my device?
How to change the display format (temperature/time) and adjust them
In what situations will I receive notifications?
My device is inaccessible on Neviweb
How do I schedule my smart devices?
Will I need to reprogram my devices after a power outage?
How to change the value of the kilowatt-hour
What happens to my Wi-Fi devices if I change my router or Wi-Fi password?
What should I do if I have difficulty connecting my Wi-Fi device to the Wi-Fi network?
Add your TH1300WF thermostat
Configure your TH1300WF thermostat
How the TH1300WF integrates with other devices in Neviweb
Add your TH1400WF thermostat
Configure your TH1400WF thermostat
How does the main output cycle work for Sinopé low voltage thermostats?
Add your TH1300ZB thermostat
Configure your TH1300ZB thermostat
Add your TH1400ZB thermostat
Configure your TH1400ZB thermostat
Add your TH1500ZB thermostat
Configure your TH1500ZB thermostat
Add your TH1120RF-3000 / TH1120RF-4000 thermostat
Configure your TH1120RF-3000 / TH1120RF-4000 thermostat
Add your TH1121RF-3000 / TH1121RF-4000 thermostat
Configure your TH1121RF-3000 / TH1121RF-4000 thermostat
Add your TH1300RF thermostat
Configure your TH1300RF thermostat
Procedure for changing the control mode of a thermostat for underfloor heating
Add your TH1400RF thermostat
Configure your TH1400RF thermostat
Add your TH1500RF thermostat
Configure your TH1500RF thermostat
Add your OTH4000-ZB thermostat
Configure your OTH4000-ZB thermostat
Add your OTH3600-GA-ZB thermostat
Configure your OTH3600-GA-ZB thermostat
Add your OTH2750-GT thermostat
Configure your OTH2750-GT thermostat
Add your OTH3600-GA-GT thermostat
Configure your OTH3600-GA-GT thermostat
Add your OTH4000-GT thermostat
Configure your OTH4000-GT thermostat
Add your INSTINCT Connect thermostat
Configure your INSTINCT Connect thermostat
Add your TH1310WF thermostat
Configure your TH1310WF thermostat
Add your TH1134ZB/HC thermostat
Configure your TH1134ZB/HC thermostat
Add your interface for HP6000ZB wall-mounted heat pump
Configure your interface for the HP6000ZB-GE wall-mounted heat pump
Configure your interface for the HP6000ZB-MA wall-mounted heat pump
Add your Pro HVAC TH6500WF smart thermostat
Configure your Pro HVAC TH6500WF smart thermostat
Add your LITE TH1133WF smart thermostat
Configure your LITE TH1133WF smart thermostat
Add your TH6250WF Lite Smart Thermostat for Central System
Configure your TH6250WF smart HVAC thermostat
Add your TH6250WF-PRO Pro Lite smart thermostat for central systems
Configure your TH6250WF-PRO smart HVAC thermostat
Devices compatible with Neviweb
Choose lighting control model
Add your DM2500ZB dimmer
Configure your DM2500ZB dimmer
Add your SW2500ZB switch to Neviweb
Configure your SW2500ZB switch
Add your DM2500RF dimmer to Neviweb
Configure your DM2500RF dimmer
Add your SW2500RF switch to Neviweb
Configure your SW2500RF switch
Add your DM2550ZB dimmer
Configure your DM2550ZB dimmer
How do I adjust the minimum light intensity of the adaptive phase smart dimmer?
Choosing an electrical outlet model
Add your SP2600ZB electrical outlet to Neviweb
Configure your SP2600ZB electrical outlet
Add your SP2610ZB wall socket to Neviweb
Configure your SP2610ZB wall socket
Choose a specialized control model
Add your RM3250ZB electric load controller to Neviweb
Configure your RM3250ZB charge controller
Add your RM3250RF / RM3200RF electric load controller to Neviweb
Configure your RM3250RF charge controller
Add your RM3500ZB water heater controller to Neviweb
Configure your RM3500ZB water heater controller
How does the low water temperature protection setting work?
Add your LM4110-ZB tank monitor to Neviweb
Configure your LM4110-ZB tank monitor
Tank monitor error messages
Add your RM3500WF water heater controller to Neviweb
Configure your RM3500WF water heater controller
Choosing a water damage protection device model
Add your VA4200WZ / VA4201WZ smart water valve
Configure your VA4200WZ/VA4201WZ smart water valve
Add your VA4220WF / VA4221WF smart water valve
Configure your VA4220WF / VA4221WF smart water valve
How do I change the batteries in my smart water valve?
Add your water leak detector to Neviweb
Configure your water leak detector
In what situations will I receive notifications?
Does the Sinopé water leak detector work without a Wi-Fi connection?
How can I test my detector?
How do I change the batteries in my water leak detector?
Why use lithium batteries in my water leak detector?
Why are my new batteries triggering a low battery message for my water leak detectors in the Neviweb app?
How do I select the type of batteries (alkaline or lithium) for my water leak detectors?
Add your VA4220ZB/VA4221ZB smart water valve
Configure your VA4220ZB / VA4221ZB smart water valve
Add your FS4220 / FS4221 flow sensor to Neviweb
Configure your FS4220 / FS4221 flow sensor
Choose gateway model
Add your GT130 gateway to Neviweb
Configure your GT130 gateway
Can my GT125 and GT130 gateways work together?
Add your GT125 gateway to Neviweb
Configure your GT125 gateway
Remove a Wi-Fi or Zigbee device from Neviweb
Choose a multifunction controller model
Add your MC3100ZB multifunction controller to Neviweb
Configure your MC3100ZB multifunction controller
Condition of the heating appliance
Mi-Wi devices: Reset the network of connected devices
The thermometer lines on my thermostat are always full even though it has already reached the set temperature, why?
Consumption graph
Better understanding of consumption graphs
Why doesn’t my device appear in the consumption graphs?
Following a move, what happens to my consumption graphs?
How far back do historical energy consumption records go?
Tips for managing your energy consumption
My consumption data is not available in Neviweb, why?
Can I download my consumption graphs?
Why has the consumption history of my SW2500ZB switch and DM2500ZB dimmer been reset?
What is the difference between the green and blue color bands in consumption graphs?
How do I download the consumption graph data in CSV format?
Automation
Automations and scenes: the differences and when to use them
The different types of automation
Creating automations with Neviweb
How to create schedules in Neviweb with the GT130?
The thermostat’s setpoint temperature is different from the temperature programmed in the time automations.
What should I do if the thermostat’s set temperature is different from the temperature programmed in the schedule?
What is time automation?
Disable an automation
Is it normal that the automation icon is missing in Neviweb for my Wi-Fi thermostats?
How can I get an overview of all the automations connected to my Zigbee device?
How can I create automations with multiple conditions linked to my Zigbee device?
How can I group my automations?
Modify an automation
Some automation ideas
The scenes
Create scenes
Some scene ideas
Edit a scene
The locations
Add a location
Can I set a location to Away or Present without geofencing?
Can I link my two locations or create cross-location automations?
What is the purpose of the postal code?
What is the purpose of the cost per kilowatt-hour?
Can I set a location to Away or Present without enabling location sharing?
Edit a location
Moving from one location to another
Geofencing
Enable geofencing
What is geofencing?
Configure the radius of my location for geofencing
The advantages of using geofencing
Do I have to share my location constantly to use geofencing?
I am unable to access the geofencing functionality on the Neviweb.com website.
Is it possible to link more than one mobile device to the geofencing feature?
What is the difference between geofencing and geolocation?
How does geofencing work with Android mobile devices (Android version 11)?
How to configure actions triggered by geofencing
The devices
How is the connected load calculated?
The connected charging status of my device is incorrect.
What connected load do I need to register in Neviweb?
How can I see a complete list of my devices?
Create a room
Name the devices
Locate a device you have just installed
One of my thermostats no longer appears in the list of devices on my Neviweb account
How to activate the tooltip
Remove a Mi-Wi device from Neviweb
I uninstalled a device, but it still appears in Neviweb. How do I remove it?
What should I do if, after removing a Mi-Wi device from Neviweb, other devices become inaccessible?
The timetables
Schedule creation
Migration of Concerto Connect and True Comfort thermostats to Neviweb
My password is incorrect. How do I create a new one?
My thermostats are not visible in my Neviweb account after the migration. What should I do?
We are pleased that this article helped you.
How can we help you ?
First name
Last name
E-mail
Telephone
Type d’appareil
>Model
*
*Thermostats
TH1123WF
TH1124WF
TH1133WF
TH1134WF
TH1143WF
TH1144WF
TH1300WF
TH1310WF
TH1400WF
TH1500WF
TH6250WF
TH6250WF-PRO
TH6500WF
TH1123ZB
TH1124ZB
TH1300ZB
TH1400ZB
TH1500ZB
TH1133CR
HP6000
*
*Valves
VA4221WF
VA4220WF
VA4221ZB
VA4220ZB
*
*Sensors
WL4200
WL4200S
WL4210
WL4210S
WL4210C
*
*Lighting
DM2500ZB
DM2550ZB
SW2500ZB
*
*Control
RM3500WF
RM3510WF
RM3500ZB
RM3250ZB
LM4110-ZB
SP2600ZB
SP2610ZB
GT130
*
Others
I don't know
Message
Upload an image ( jpg, png, heif et webp - Maximum de 5 mb )
Submit
Thank you, we will contact you soon.