


Comma-separated values (CSV) files present the data collected without any particular formatting and are, therefore, the universal format for viewing your consumption data in various applications such as Microsoft Excel, Numbers or Google spreadsheet.
All the data listed in the Neviweb consumption graphs (energy and water consumption) can be downloaded in CSV format, allowing users to save it over time and analyze it.
Here are the steps to download Neviweb consumption graph data in CSV format.
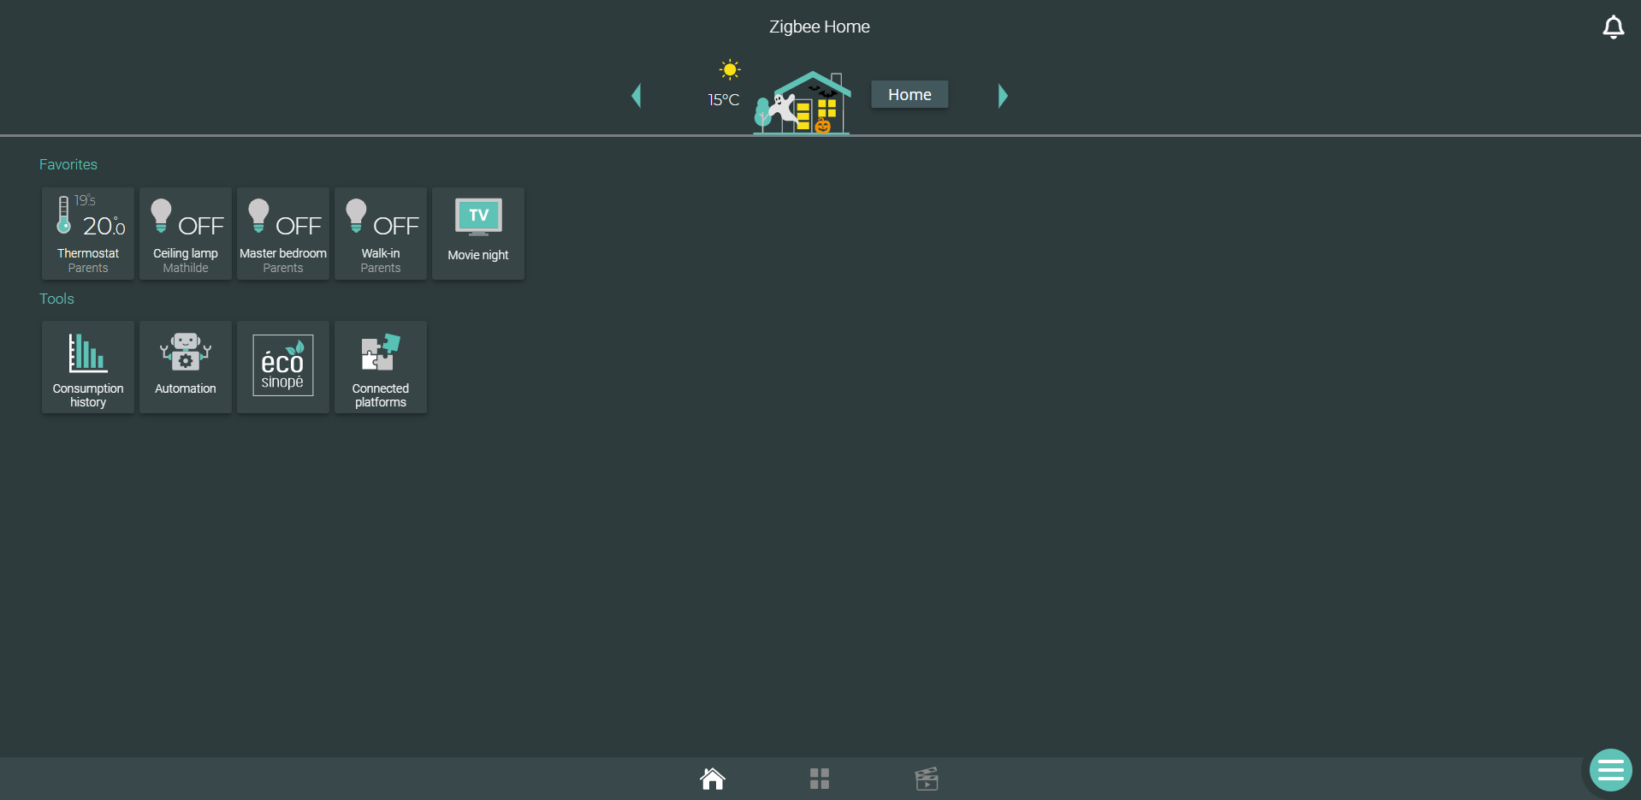
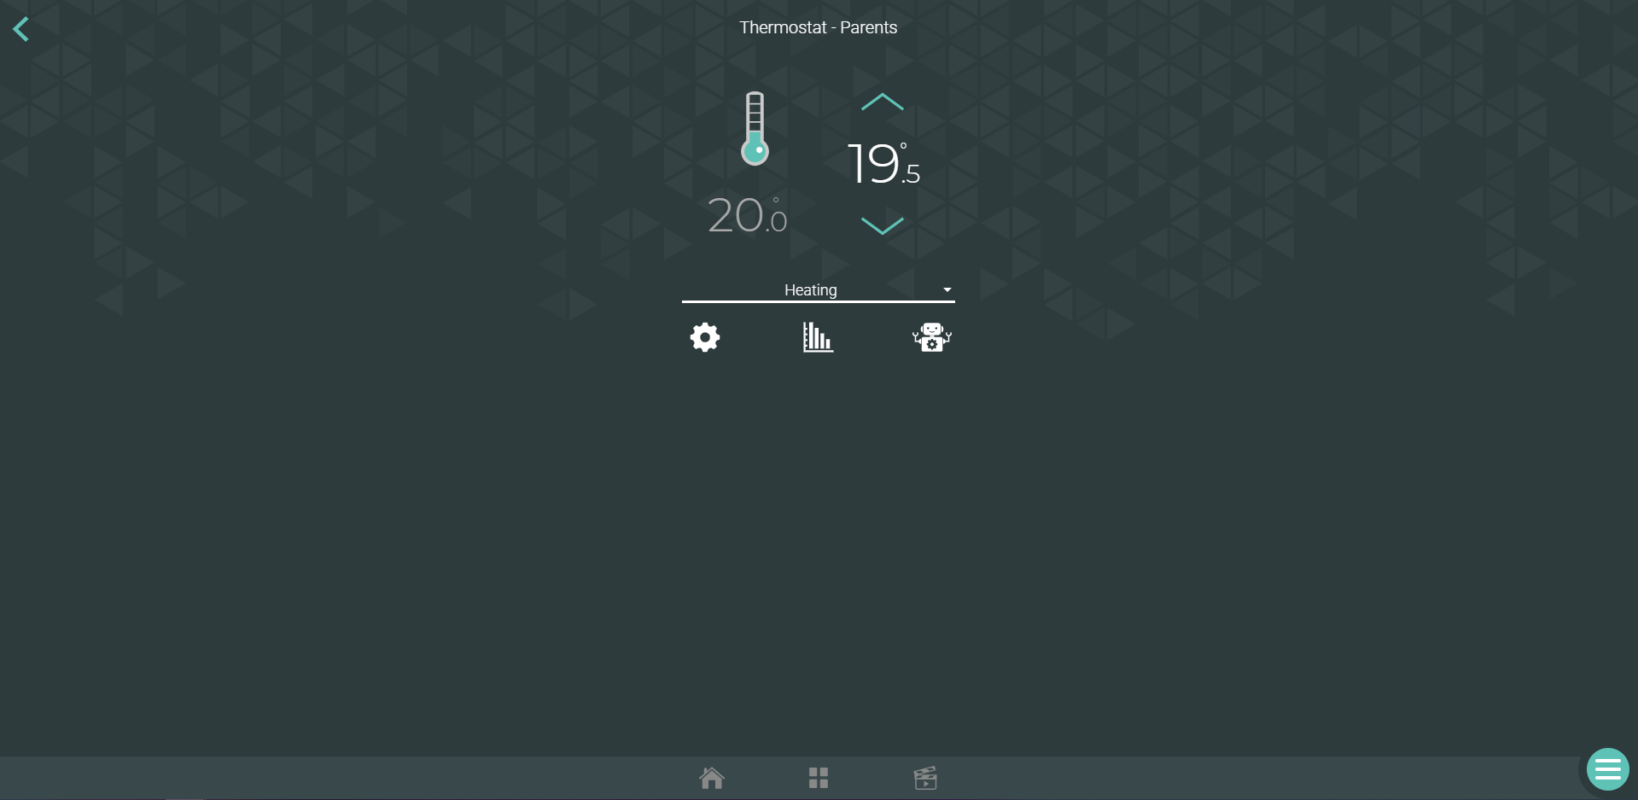
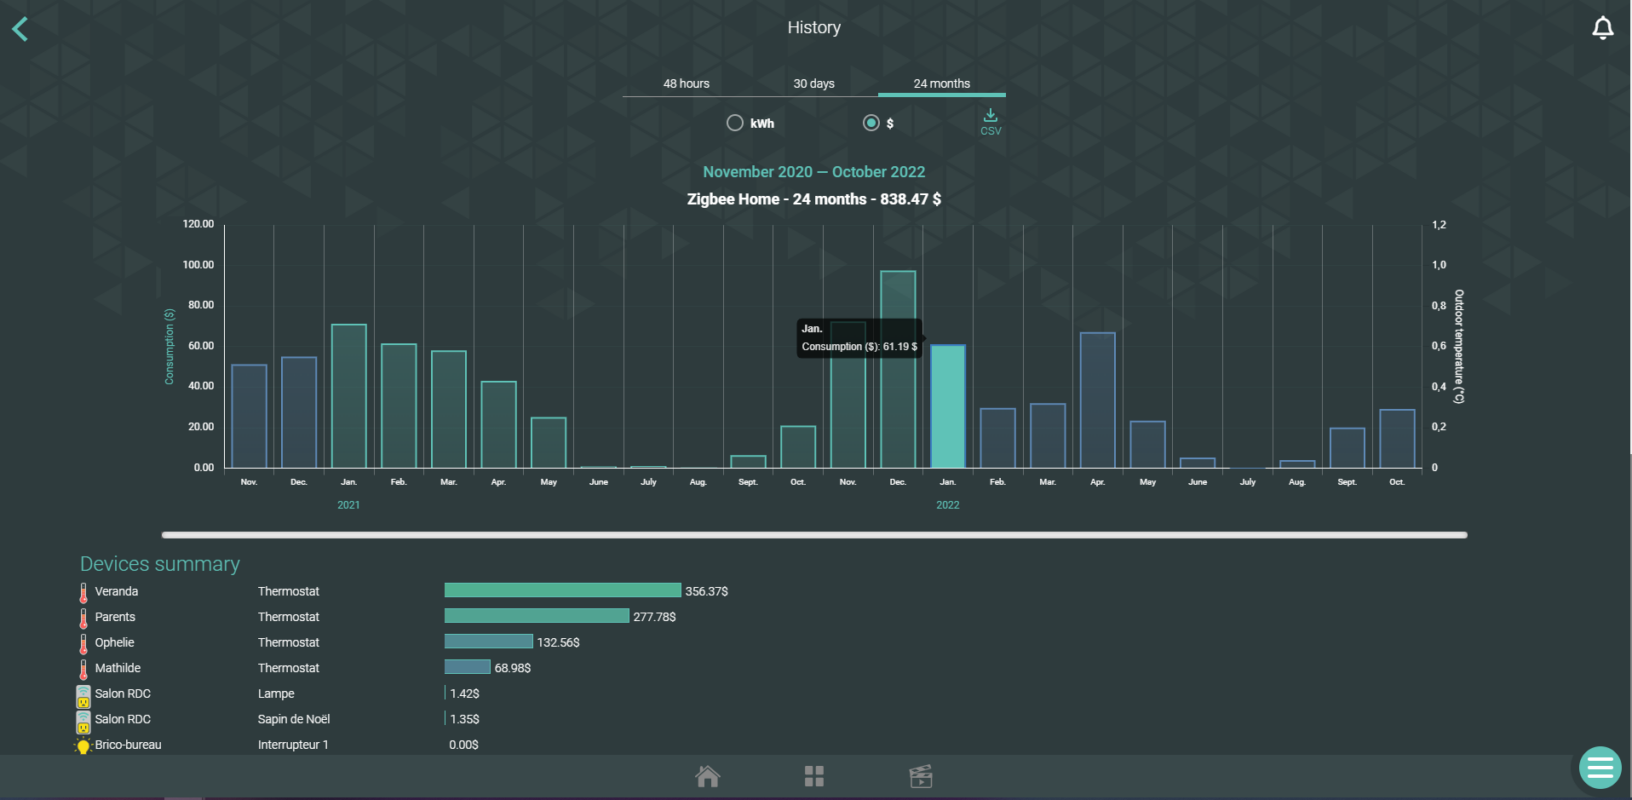
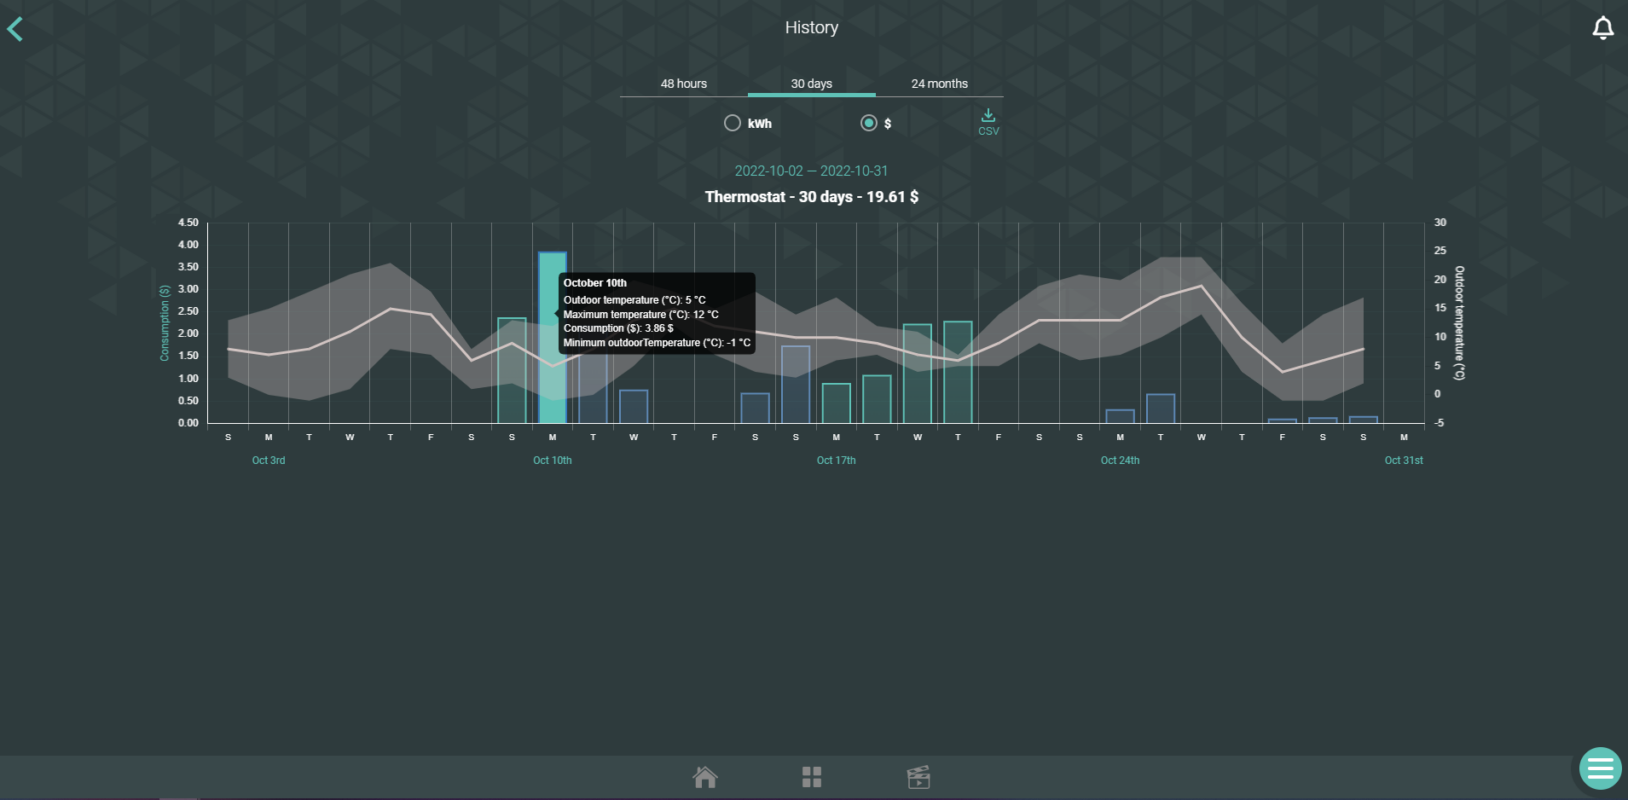
Select the consumption graph for which you want to download the data. You can download data for a single device or the entire location.
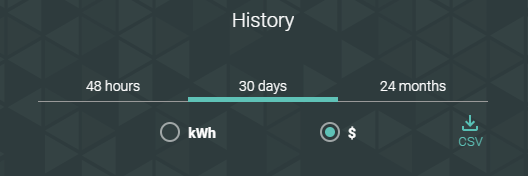
Select the data that you wish to include in the CSV file (48 hours, 30 days, 24 months / kWh or $).
Click on the CSV download icon.
Ce site est offert dans d'autre langue. Veuillez choisir votre préférence.